America's Cup yacht tracking, data & graphics: Where did it all start?
by A+T Instruments 6 Sep 2024 11:15 BST

The story of SailVision © A+T Instruments
We have all got used to the ever improving and impressive graphics, tracking and analysis used for America's Cup TV coverage and that of SailGP. But when, where and how did this all start?
The answer lay in the last downwind leg of the 'Race of the Century' between John Bertrand on Australia II and Dennis Connor's Liberty in September 1983. Liberty had led into the last downwind leg of this race and then allowed Australia II to gybe away and eventually pass and round the bottom mark with a lead of 21 sec - and the rest is history. However, on the most exciting leg of the most exciting race in all America's Cup history, the commentators had no idea who was ahead or passing because they had no idea where the boats were relative to the wind and the course marks.
Back in Perth at the Royal Freshwater Bay Yacht Club, Hugh Agnew sat down with some of the key members of the Australia II crew to see if this could be solved for the '87 Cup in Fremantle. Hugh, a yacht navigator, was then leading a Perth based specialist navigation company in the offshore and defence businesses. They threw their weight behind the challenge.
And a challenge it was. This was long before GPS and there was no chance of co-operation from the competitors; these were the days of shrouds on keels and using submersibles for spying. So no data from the boats was available, the race organization were hard to persuade to allow access to the course plus who would pay for this?
In the end, all obstacles were overcome, and Graham Walker's Crusader team tender was used. This was fully equipped with the latest navigation computers, Syledis land-based radio positioning system and B&G wind instruments with a privilege flag allowing the boat to run inside the spectator fleet on the course.
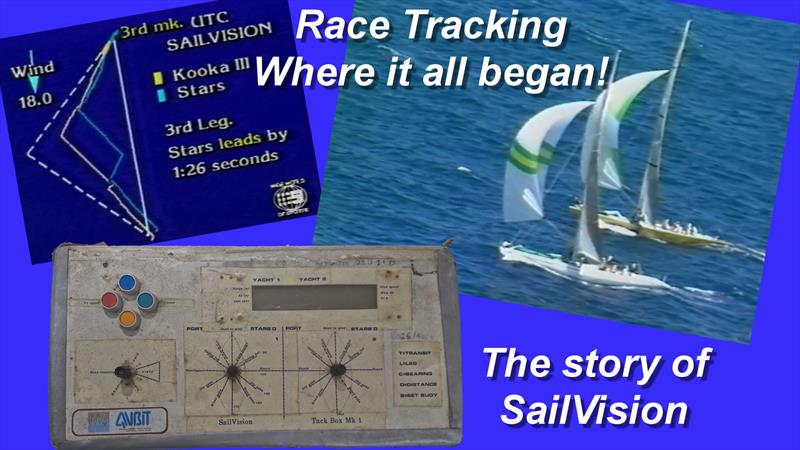
The system called Sailvision was born and used for the Challenger series, Defender series and the eventual final between Ian Murray's Kookaburra III and Dennis Connor's Stars and Stripes with the resulting graphics being overlaid and used in the worldwide television feed to over 20 million viewers.
The tracking was based around a dead reckoning using generic 12m performance polars and the wind speed and direction as measured on our boat. The point of sailing of each boat was updated manually as was each tack and gybe and the model was then updated using a combination of hand bearing compass, horizontal sextant angle and laser rangefinder using 'nudge' buttons to keep the model aligned with observations. The results were remarkably accurate in terms of lead margins, time to mark and showing how much wind shift was needed to change leader when boats were separated.
So, this was the start and since then others have moved the technology and visualisations forward, of course now fully assisted by streaming of all data and positions off the competitors and fully integrated with the race management. In 1987 access to the mark buoy positions was not even given and had to be puzzled out. Despite this the results were remarkably good and regularly used by the commentators to explain about wind shifts and lead extensions.
Hugh Agnew continued developing navigation systems including the Yeoman plotter in the 90's, owning and running B&G in the 2000's and then with Richard Tinley founding in 2015 A+T Instruments a leading manufacturer of very high end yacht instruments. He would be happy to take any questions or hear from the many others who have worked in this area since at .
A+T are proud of the heritage, having led this world first 37 years ago, and now providing the highest quality instruments and sensors made for racing and superyachts.
Find out more at www.aandtinstruments.com